Community Cat Program Map
I'm a geographer, cartographer and environmental scientist who prefers her data served, visually
Authored 14 Mar 2021
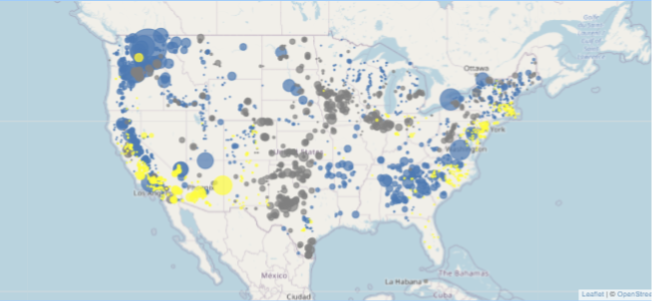
Proportional symbol map of US wind and solar power plants based on electric capacity. Popup provides power plant name and capacity in mw.
Data filtered for only wind and solar power plants and radius of circle proportional to electrical capacity in Leaflet version 1.7.1 in collaboration with OpenStreetMaps.
Data Sources EIA's form 923
Authored 9 May 2021
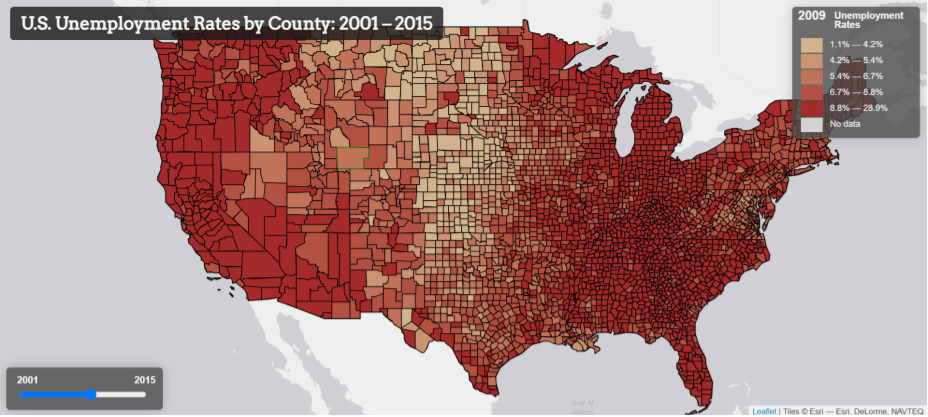
A timeseries choropleth map with slider detailing unemployment rates of USA counties.
CSV data loaded and dynamically produced as layers in Leaflet cued by time slider bar.
Data Sources Bureau of Labor Statistics and Cartographic Boundary Shapefiles
Authored 3 Nov 2021
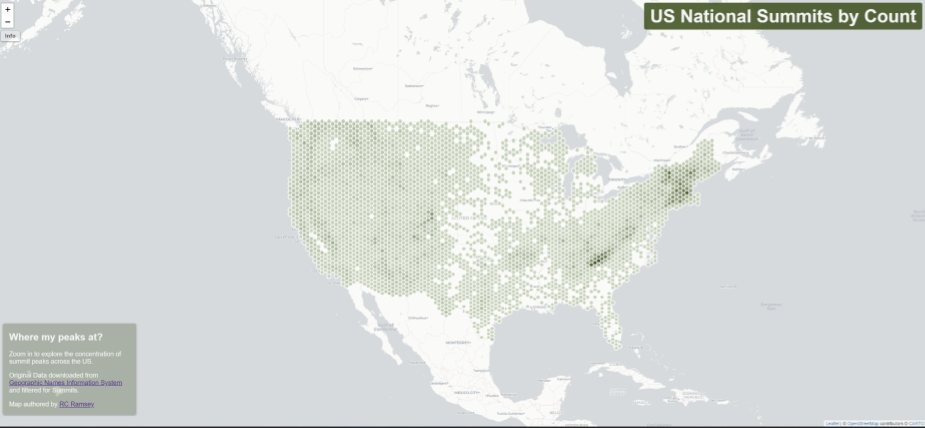
A map exploring the concentration of summit peaks across the US
CSV data accessed through a node built script to build hexgrid from 1000s of points with turf.js. Then d3.js library to fetch data. Produced/revised through Leaflet version 1.7.1.
Data Sources US Board Geographic Names
Authored 8 June 2022
Presented NACIS 2022
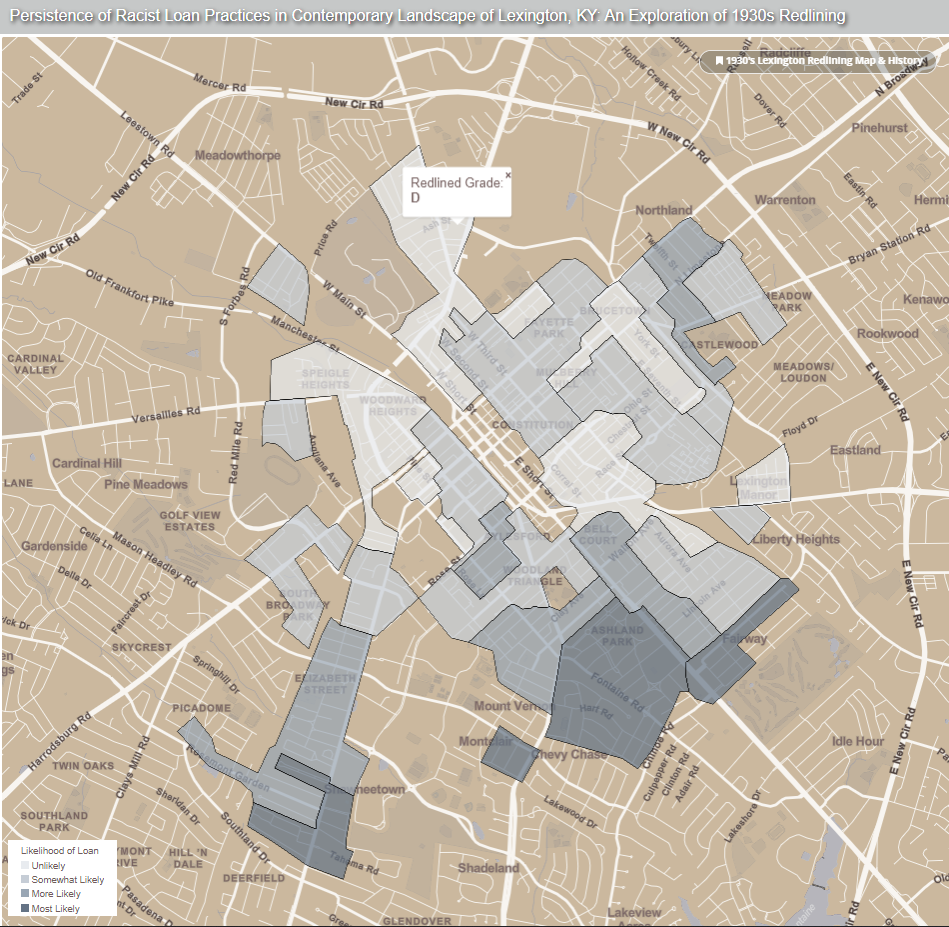
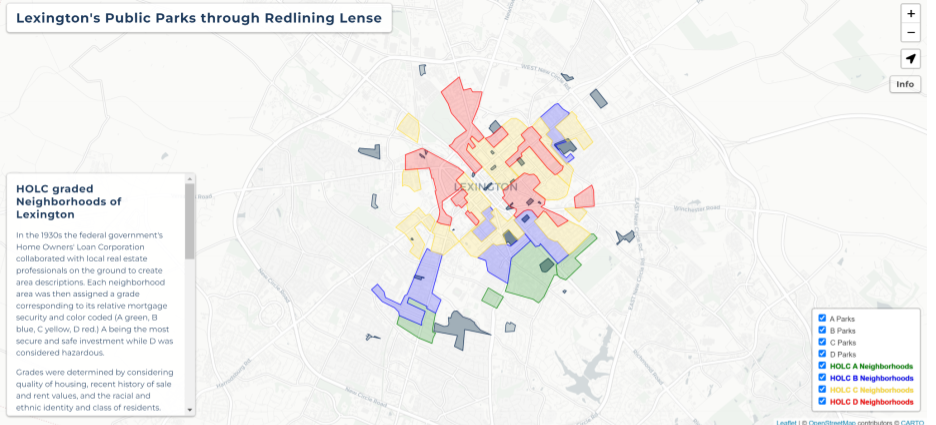
An interactive web map using HOLC redlining maps as a lense through which to view various aspects of wealth today in Lexington KY.
Data refined utilizing python libraries numpy, geopandas, pandas, matplotlib, jupyter, then produced using html/svg/css for ui/ux and website styling, d3.js to load data as json and Mapbox GLJS for loading vector tiles and smooth interaction.
Data Sources All links provided in Github Repo (U.S. Census Bureau, OpenStreetMap contributors Query, Mapping Inequality)
Authored 20 Jun 2021
Presented NACIS 2021
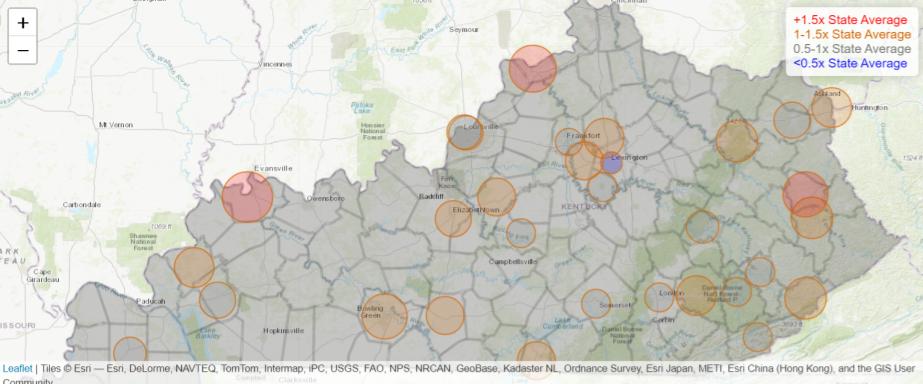
A Webpage dedicated to investigating the burdens of jail phone rates from 32 facilities in KY. Primary map focus is a proportional circle radius map of 15 minute phone rates.
CSV data accessed as geoJSON and produced/revised through Leaflet version 1.7.1. Utilized QGIS 3.16 for data manipulation and export of png for secondary maps.
Data Sources on webpage
Authored 18 Jan 2023
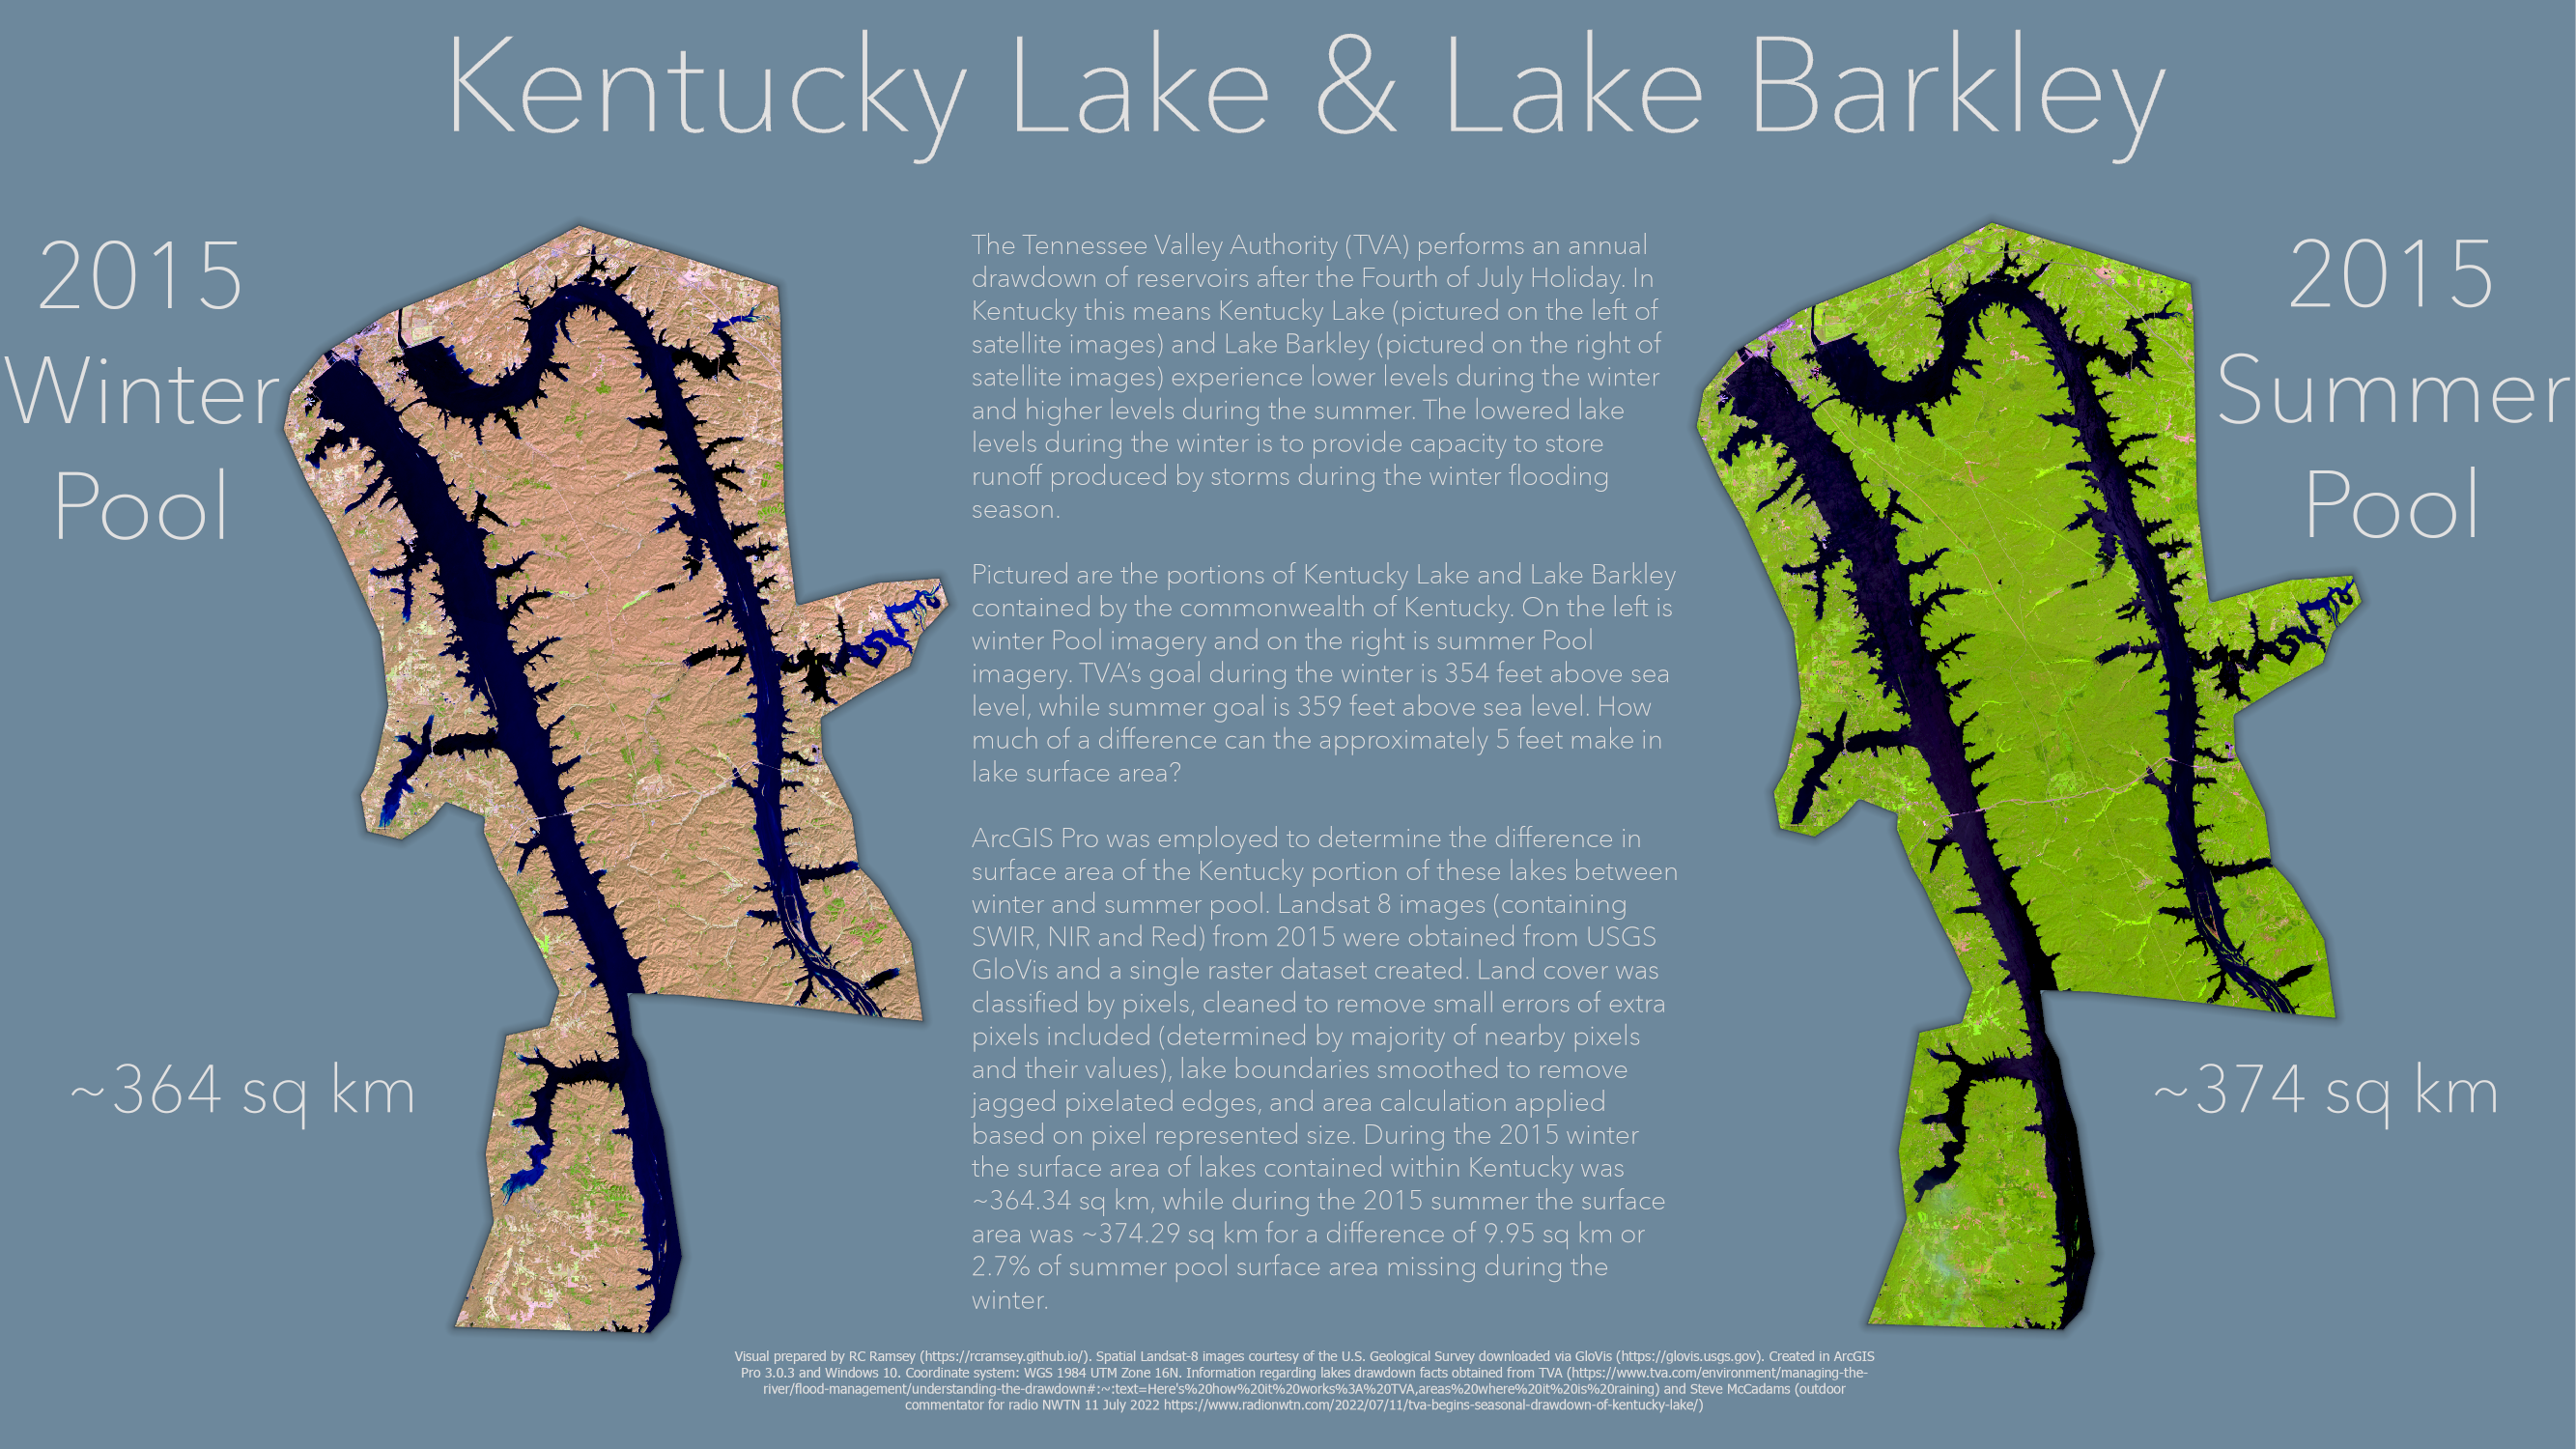
A new github repo project to explore more of the capabilites of ArcGIS Pro to dig more into it's capabilities. Focusing on one particular object, two Kentucky Lakes (Kentucky Lake and Lake Barkley) to tinker with the variety of ways this object can be visualized.
Landsat 8 imagery accessed via USGS GloVis and processed in ArcGIS Pro 3.0.3
Data Sources in Github Repo
Authored 15 Oct 2022
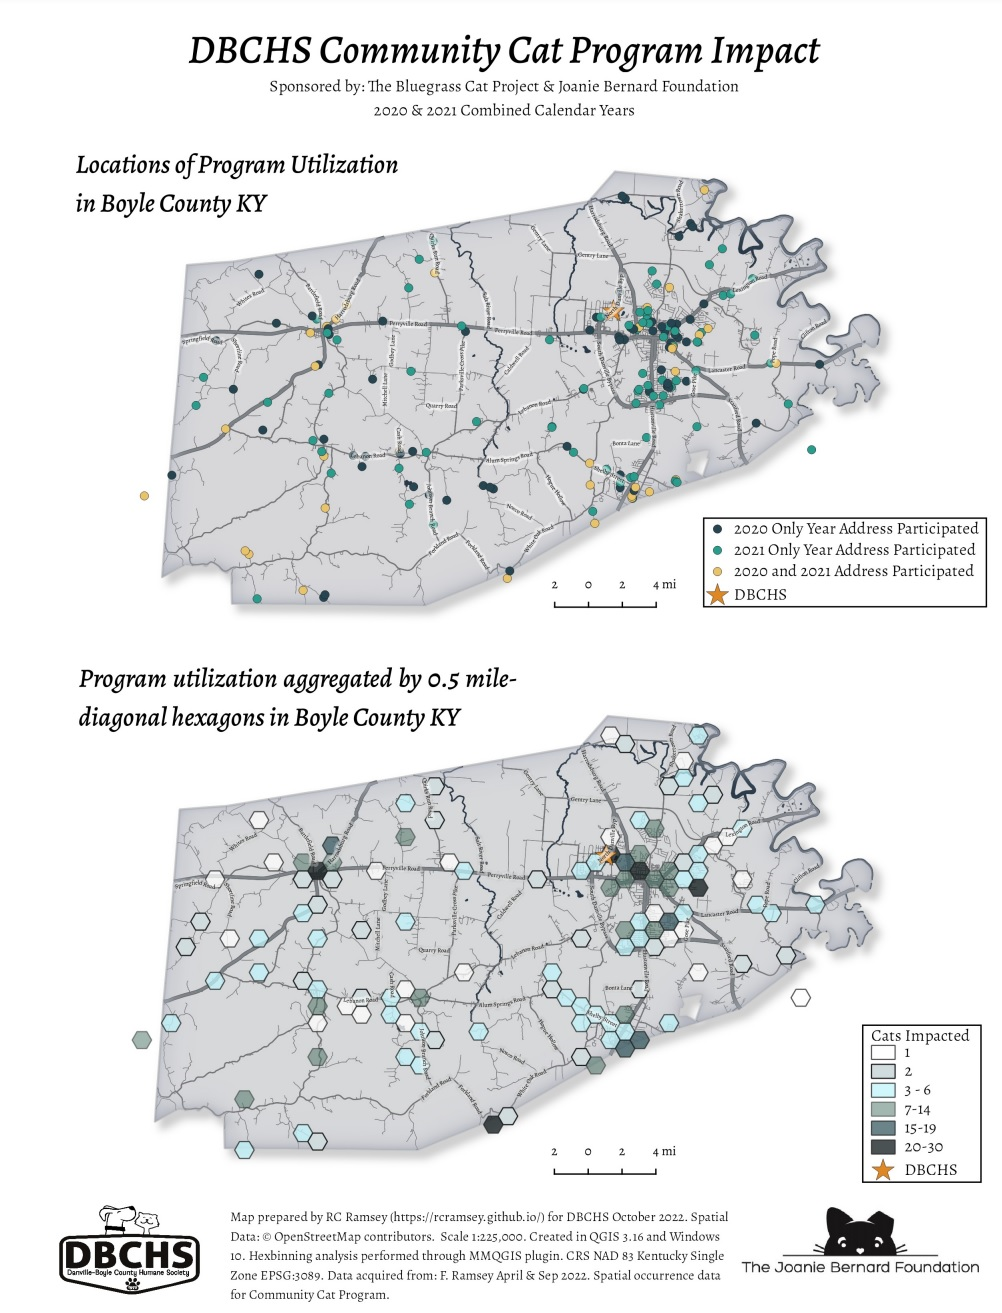
A density static map featuring location utilization of the Danville-Boyle County (Kentucky) Humane Society Community Cat Program.
Utilized QGIS 3.16. Hexbinning analysis performed through MMQGIS plugin.
Data Sources OpenStreetMap contributors Query
Authored 9 April 2021
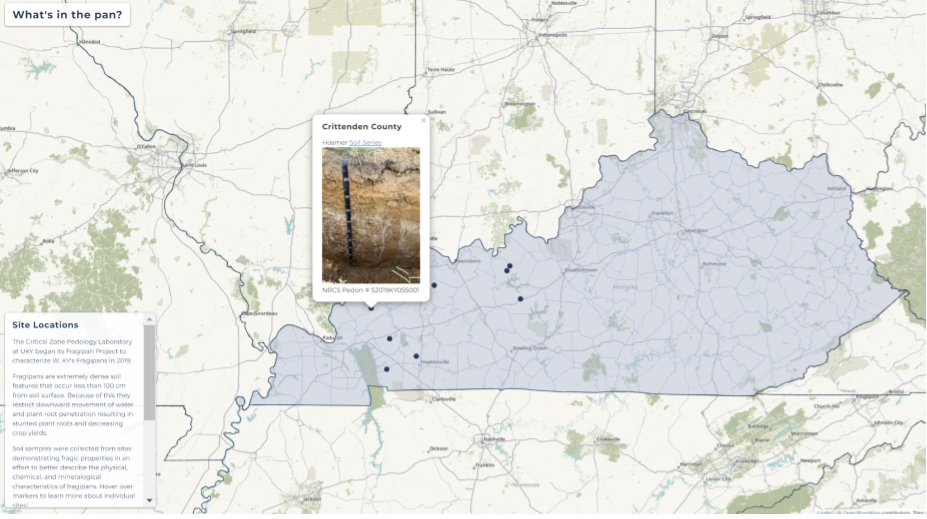
The Critical Zone Pedology Lab Fragipan Site Locations. Individual sites produce popup displaying a photo of the project site pedon, NRCS assigned soils number and identified soil series description. Geolocation services enabled.
GeoJSON data edited through geojson.io then produced and revised through Leaflet version 1.7.1
Data Sources on map
Authored 3 Dec 2020
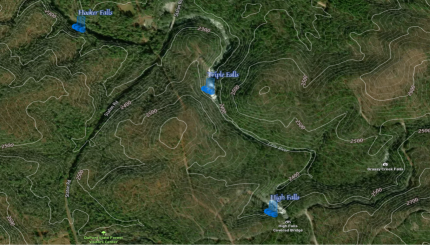
Zoom and pan slippy satellite map containing contours and named waterfalls of North Carolina.
QGIS 3.10 used to store/query dataset. GDAL and QGIS 3.10 to convert raster elevation units and create contours from USGS NED 1/3 arc-second raster DEM. SVG created via Inkscape. Data shown on Mapbox web map utilizing OpenStreetMap. Geolocation services enabled.
Data Sources USGS GeoNames
Authored 20 Oct 2022
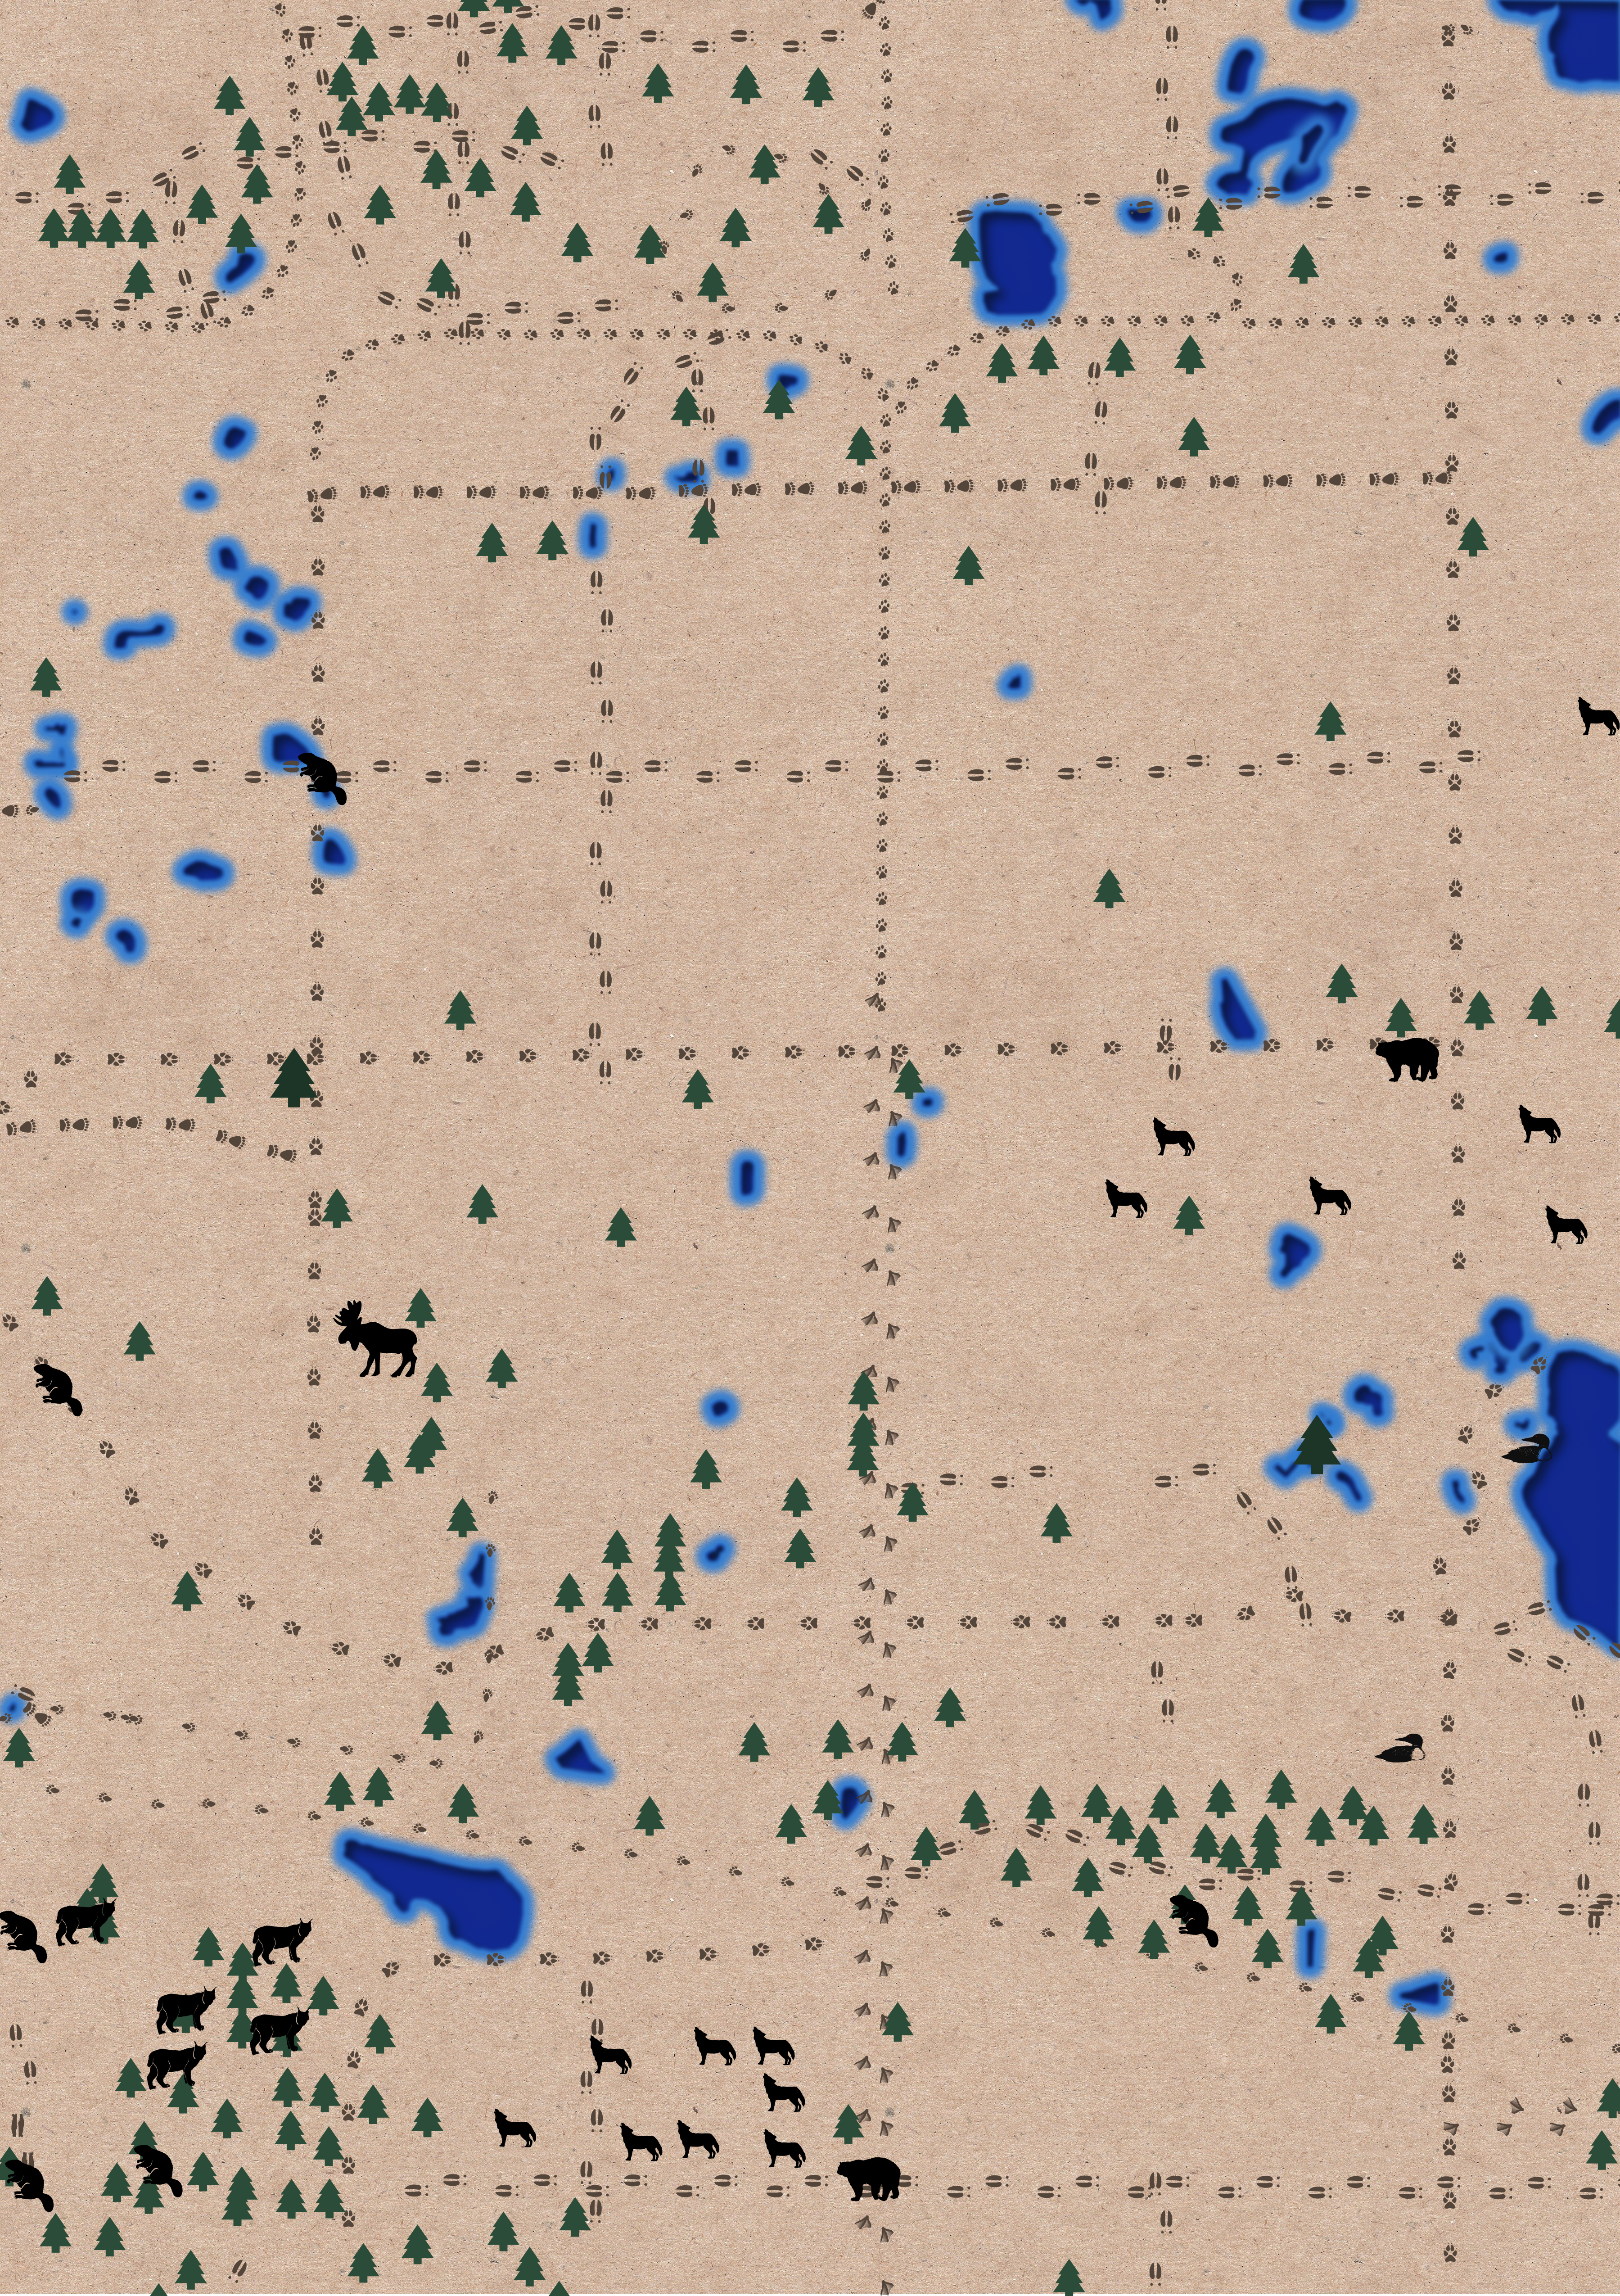
A quadrant tile created as a part of a collaborative Cartographic Quilt Map Project revealed at Annual NACIS 2022 Conference.
Data collected and refined via QGIS and QGIS OSM plugin (QuickOSM). Created/supplemented SVGs in Inkscape. Documented via jupyter. Final product a static pdf.
Data Source OpenStreetMap contributors Query
Authored 17 Dec 2020
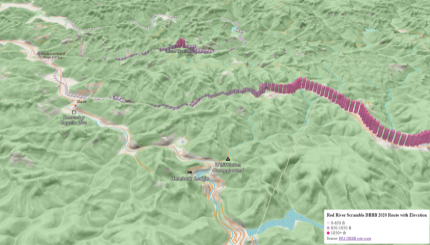
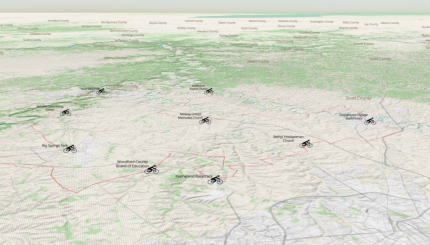
Kentucky's Red River Scramble Motorcycle Rally DBBB Route. Zoom and pan slippy map featuring 3d representation of elevation, major roads, cities and amenities/points of interest.
QGIS 3.10 used to convert GPX track, create layer, and assign raster elevation units from DEMs. Data displayed through Mapbox web map collaborating with OpenStreetMap. Geolocation services enabled.
Data Sources Red River Scramble
Authored 6 Nov 2020
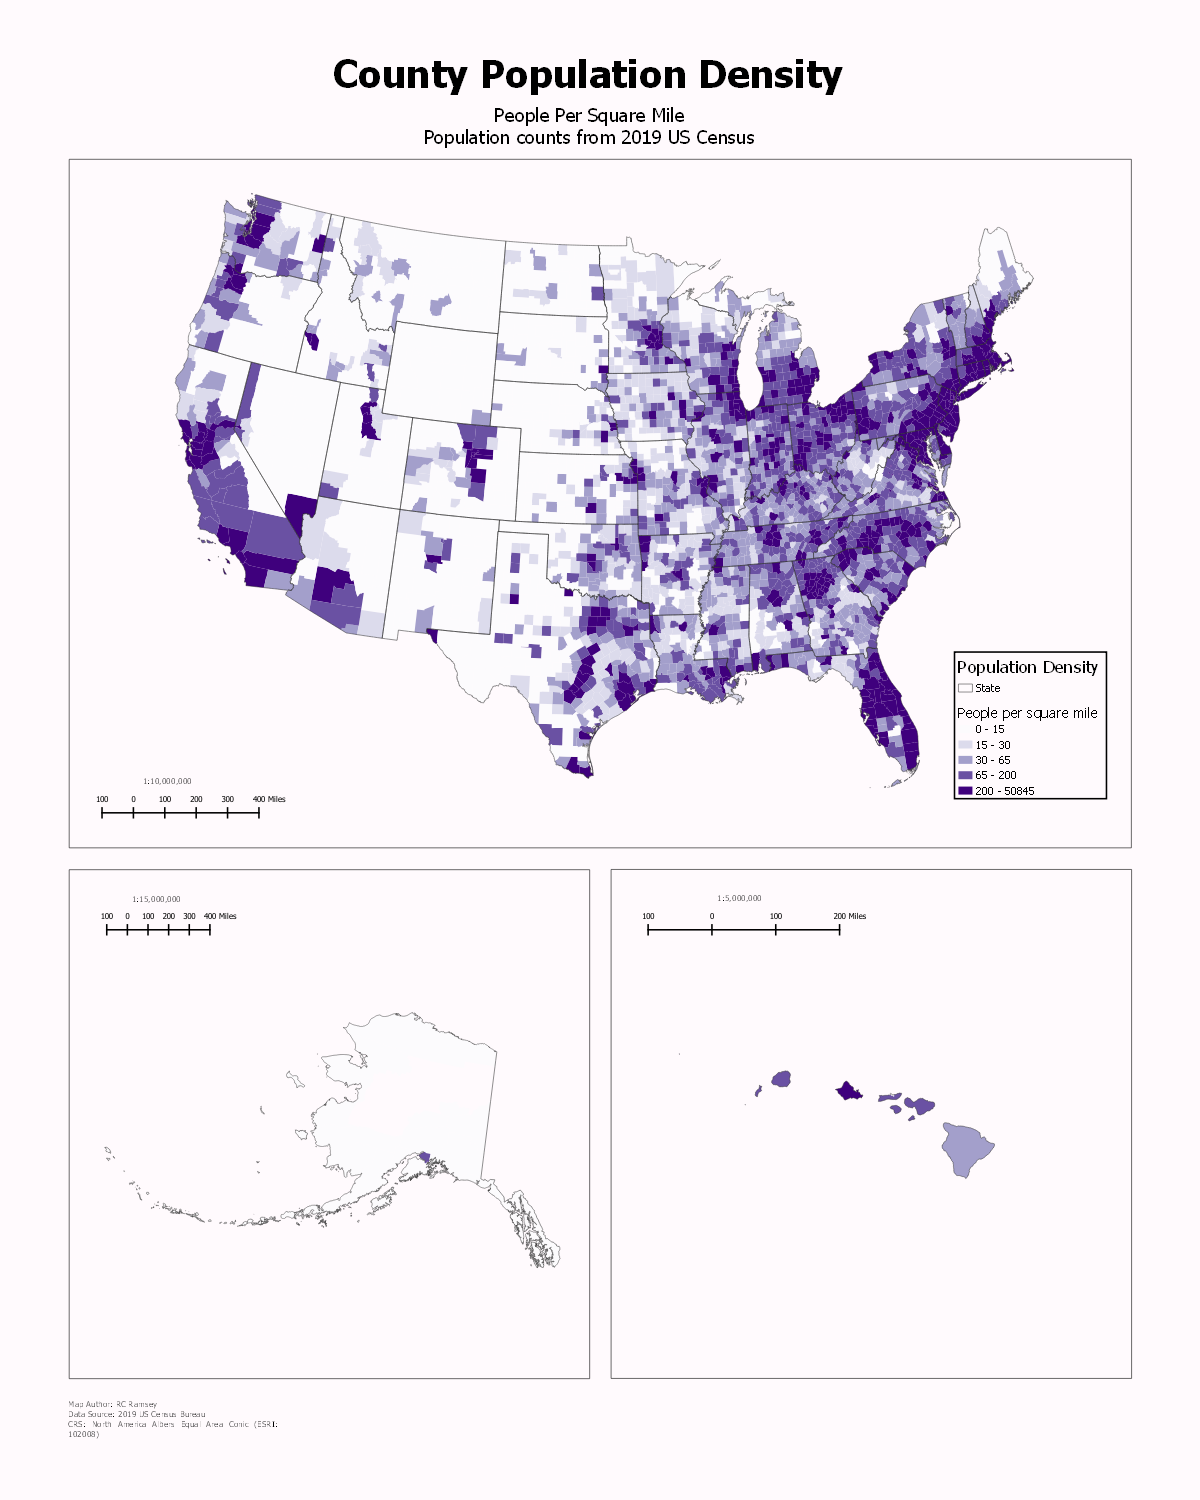
A classed choropleth static map of USA's 2019 population by County.
Utilized QGIS 3.10
Data Sources on map
Authored 13 Nov 2020
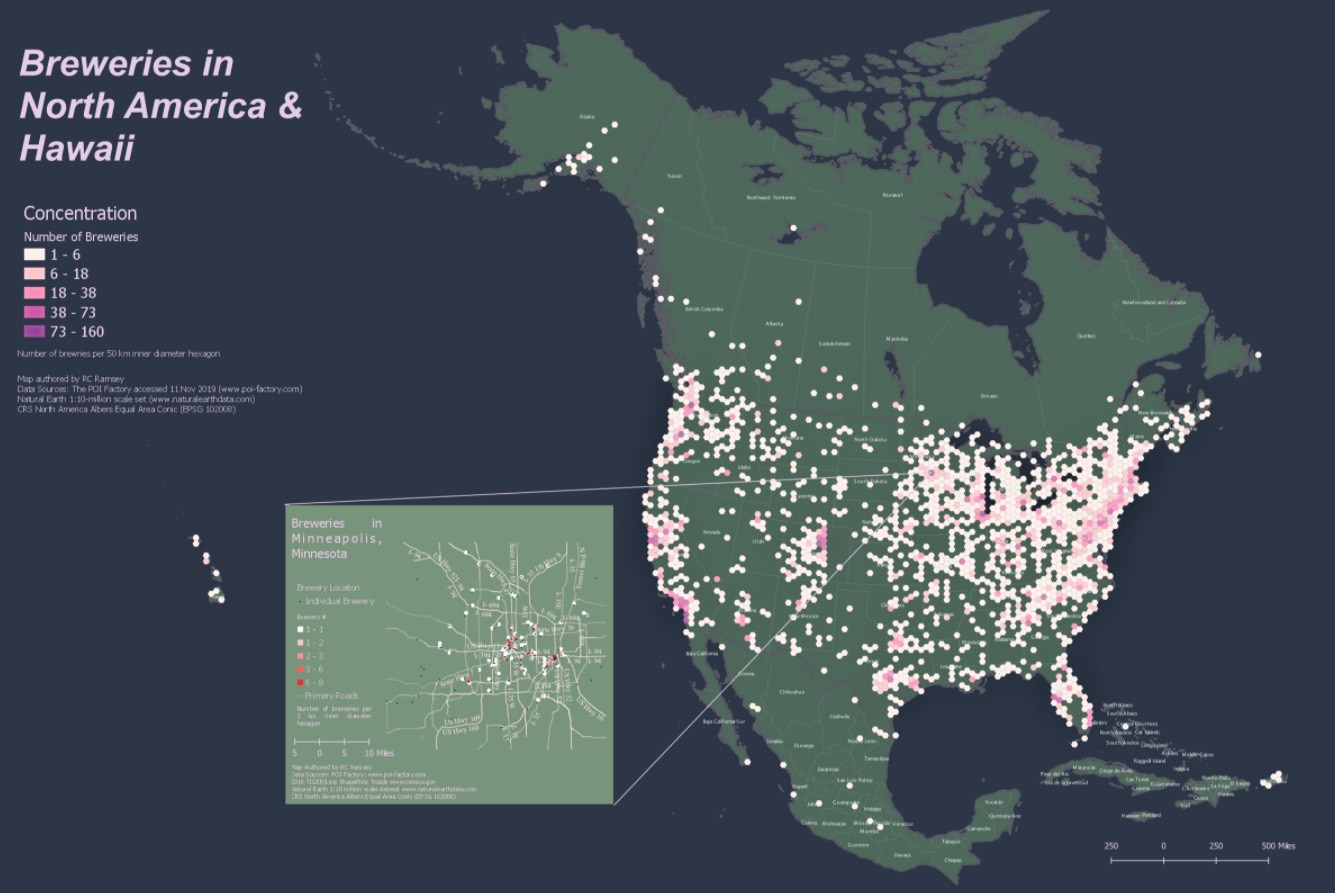
A density static map featuring N. American Brewery concentration in 2019 with a zoom of Minneapolis MN.
Utilized QGIS 3.10. Hexbinning analysis performed through MMQGIS plugin.
Data Sources on map
Authored 13 Dec 2020
Horsey Hundred Century Bicycle Route with Rest stops indicated via SVG.
Route extracted from Ride with GPS published by Horsey Hundred Routes and edited within QGIS 3.10. GPX track and rest stop layer converted for use with Mapbox. SVG created via Inkscape.
Data Sources Horsey Hundred Routes
Authored 21 March 2021
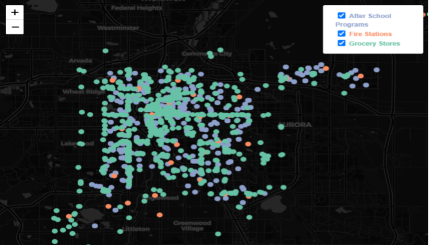
Interactive amenity map for Home Hunting in Denver, CO. Map based on three requested amenities (layer toggle control enabled) that are limited to 1 km range from map click. Amenity type and description provided on click.
Drawn using Leaflet version 1.7.1 in collaboration with OpenStreetMaps
Data Sources on map
Authored 7 Aug 2021
A map meant as an exploratory tool to determine what legacy remains today with regards to redlined neighborhoods of Lexington in the 1930s and their access (within 0.5 miles) to public parks.
Data refined utilizing python libraries geopandas, rasterio, matplotlib, jupyter, psycopg2, geoalchemy2, geopy then produced and revised through Leaflet version 1.7.1
Data Sources Mapping Inequality and OpenStreetMap contributors Query

Hi, I'm Rebecca. I'm a Geographer, Cartographer and Envrionmental Scientist specializing in spatial analysis, frontend JS development and web mapping employing the generous opensource use of Mapbox, OpenStreetMaps, and a cool library called leaflet.
I enjoy the bridging of Front-end mapping with Back-end GIS Analysis. My recent project: Playing with Lidar and satellite imagery on a tree inventory for a local non-profit.
When I'm not yelling into the void about coding errors, I'm reading, writing, hiking, camping and making memories with my family.
If you want to dig into some of my technical documenation for how the above magic happened or see my favorite mappy social interactions visit my Github or LinkedIn linked below.
Check back later to see what new additions have made it into the Ramsey Archives.