WMMT Radio Station's Range and Incarceration Facilities its signal Reaches
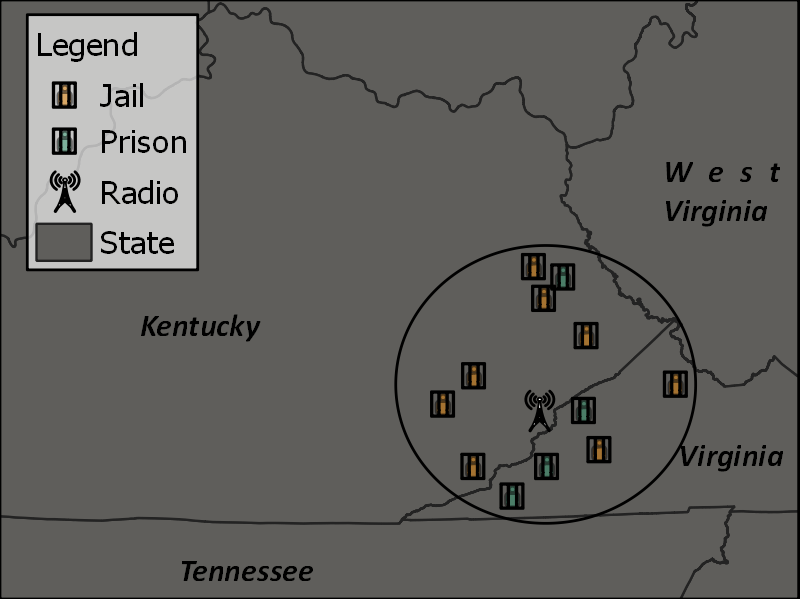
The above map explores the cost of a 15 minute phone call from 32 different jails across Kentucky (Prison Policy Initiative 2018). An average from all facilities mapped was determined and the jail’s respective value in relation to this average (above or below) is presented upon click. These inflated costs are a blatant roadblock Kentucky’s jails construct leading to re-incarceration of vulnerable populations.
Isolation or solitary confinement is a common practice among incarceration facilities and is employed as a form of punishment, but what is oftentimes overlooked is the isolation of the incarcerated from communications to the outside world. Incarceration facilities operate with technology out of the 80’s with walkman, typewriters, paper/pencil and time constrained telephones (On the Media Interview with John J Lennong). Only recently have a few facilities incorporated technology (e-tablets) permitting limited email (for a fee). If the stated end goal of incarceration facilities is the successful permanent reintegration of their members back into society as responsible citizens, how are they expected to accomplish this if they’re isolated from the community they are to return to?
Fifteen years ago, WMMT (radio station 88.7 operating out of Whitesburg, KY), began broadcasting recorded toll free call-in phone messages from friends and family members of the incarcerated during their Calls from Home program (see video on right). The station continues to this day to offer this imperative service reaching many prisons, regional jails and detention centers (see map).
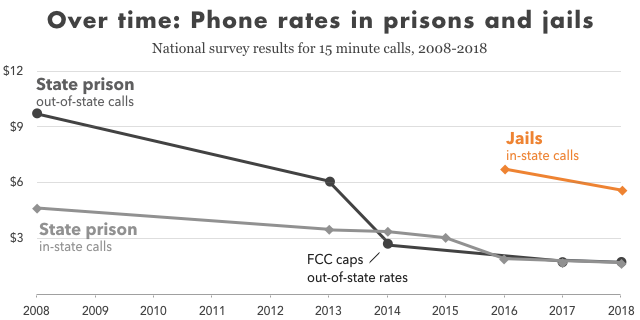
WMMT took it upon themselves to incorporate the new program to address the needs of their audience members. It wasn’t until 2014 that the FCC placed caps on the exorbitant rates or fees for phone calls within prisons. This lead to a cap of $0.21 per minute with a max $3.00 per 15 minute phone call (see line graph). Unfortunately, jails did not benefit from this and their rates remain on average 3 times higher.
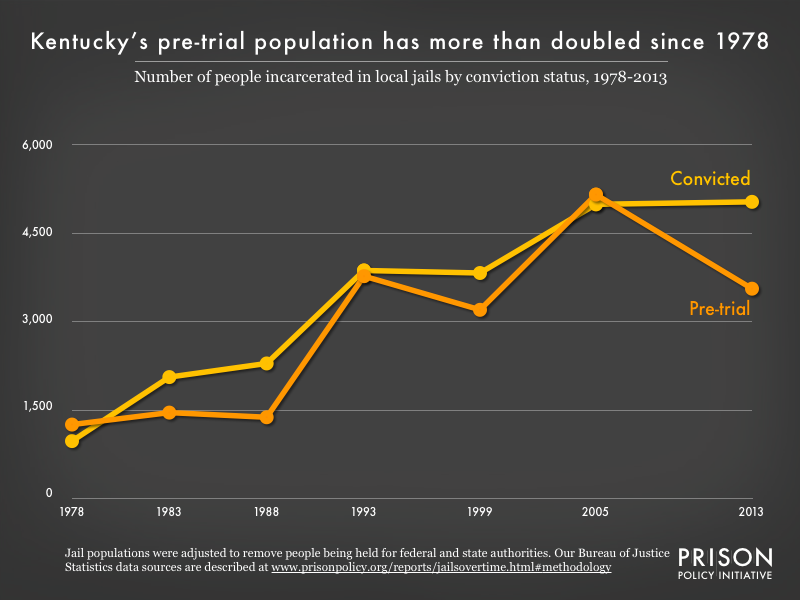
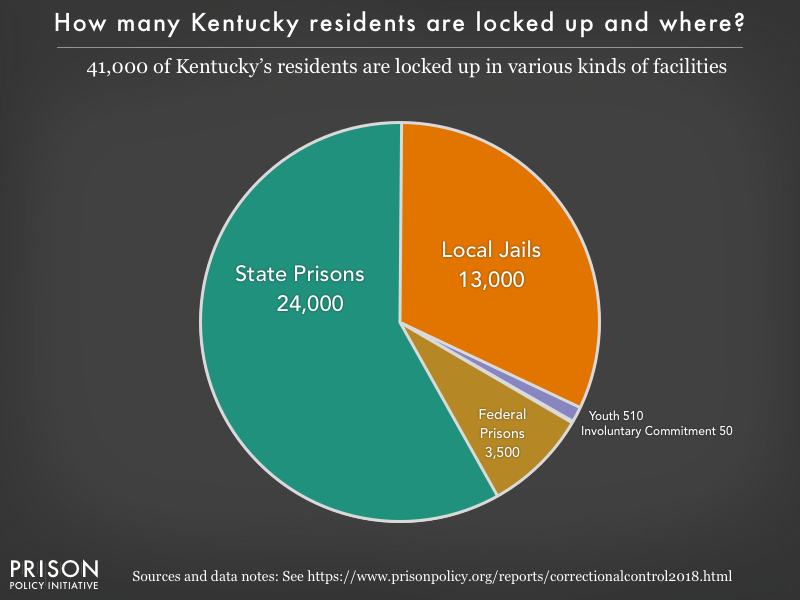
In Kentucky the pre-trial population in jails has more than doubled since 1978 (see line graph) and on any given day incarcerates approximately 13,000 residents (see pie graph). Jails are providing a literal “captive market” and negate the “innocent until proven guilty” statement as ¾ of those in jails (approximately 9,750 of the aforementioned population) are not convicted or even sentenced but rather are held pretrial if bail can not be met. The high price of phone communication drives up the cost for counsel and makes it harder to contact others to make bail or build a defense. The prevention of making bail, increases the risk for the pre-trial population of losing their job, housing, and/or custody of children the longer their wait. Phone calls are imperative.
There are many reasons a legacy of phone rates and fees are high across jails. Jails are smaller entities in comparison with prisons, have a less flexible budget and are less eager to think long term as they are ran by elected officials looking toward the next election. Additionally the population impacted find it difficult to sustain pressure on the jail administrators as most people are released in hours or days. Compounding the issue, is the corporate consolidation of phone contract providers to 2 primary providers (and 14 smaller entities) since 1984 (Prison Policy Initiative) making it virtually impossible to negotiate better rates.
High phone rates (what you pay per minute) leads to overlooking another exacerbating problem, hidden fees. When receiving a phone call from jail a person has a few options to answer. Initially they could connect the call for a special fee and pay the associated rates and taxes OR they could set up an account (surprisingly less expensive in the long run) to avoid the special fee for connection. HOWEVER, hidden fees include: a fee to open an account to pay for accumulated phone costs, a fee for having an account, a fee to listen to a voicemail, a fee to load money into an account, a fee to close the account, a fee to get a refund, a fee to receive a paper bill and more. On top of this, persons living in poverty are the most likely to be incarcerated or have incarcerated loved ones and less likely to have bank accounts so they tend to use money transfers. Even the money transfer companies get in on the business by charging another fee to transfer money into an account (in Kentucky $6.99-11.99). When the FCC was investigating the fees for prisons, they stated the fees “can increase the cost...” of communication “by as much as 40%.”
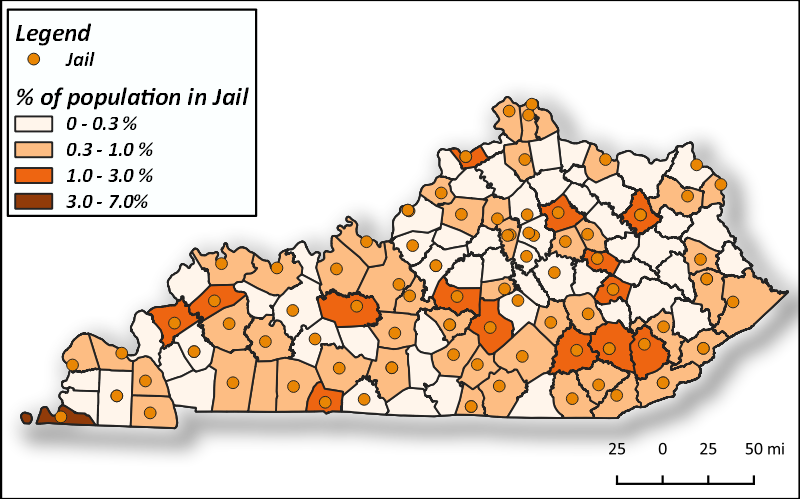
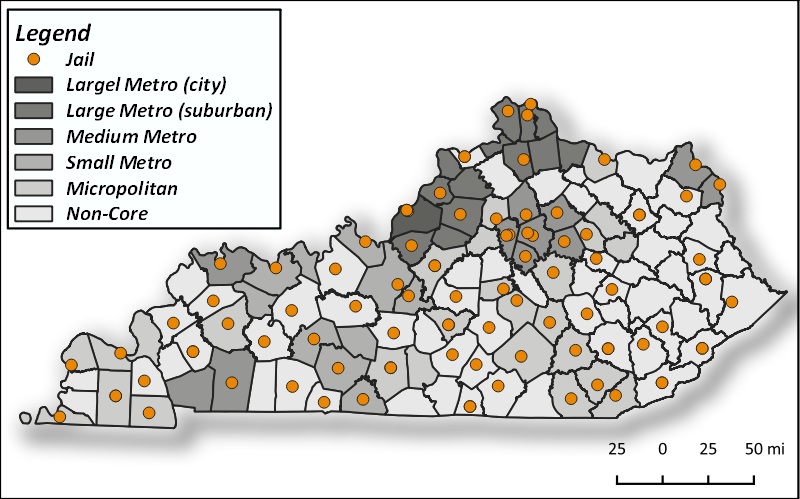
Increasing the likelihood of relying on phone communications is the urban vs rural status of a county (see map). The more rural a county, the less access family’s have to public transportation (if no vehicle is owned). Rural counties are also known for a longer commute to facilities requiring the visitor, if employed, to take off work, losing critical income in comparison to paying phone rates/fees. Additionally, some counties relocate their incarcerated populations to external counties as they do not house their own jail, increasing the distance between the incarcerated and their families. As of May 2021 the percentage of a county’s population being incarcerated (see map) ranged from 0-7% demonstrating the percent of a county impacted by these rates and fees.
There’s no better time than on the heels of the FCC’s capped rates than now to begin a conversation with Kentucky’s elected officials about negotiating better phone rates and limiting abusive fees on the vulnerable populations the incarceration facilities are attempting to serve. The topics of the conversation proposed should include how jails should refuse kickbacks/commission on phone rates, and strike harder bargains with their providers. The only way to obtain the aforementioned end goal of successful permanent reintegration of members into society as responsible citizens is to halt the isolation of these citizens to their communities.
WMMT Calls From Home Documentary Video
 Conviction status of KY's incarcerated (Jail)
Line Graph
Conviction status of KY's incarcerated (Jail)
Line Graph
 Comparing National Phone rates of Prisons vs Jails 2008-2018
Line Graph
Comparing National Phone rates of Prisons vs Jails 2008-2018
Line Graph
 KY's Incarcerated populations by Facility type
Pie Graph
KY's Incarcerated populations by Facility type
Pie Graph
 KY Urban vs Rural Counties and Jail Location
Map
KY Urban vs Rural Counties and Jail Location
Map
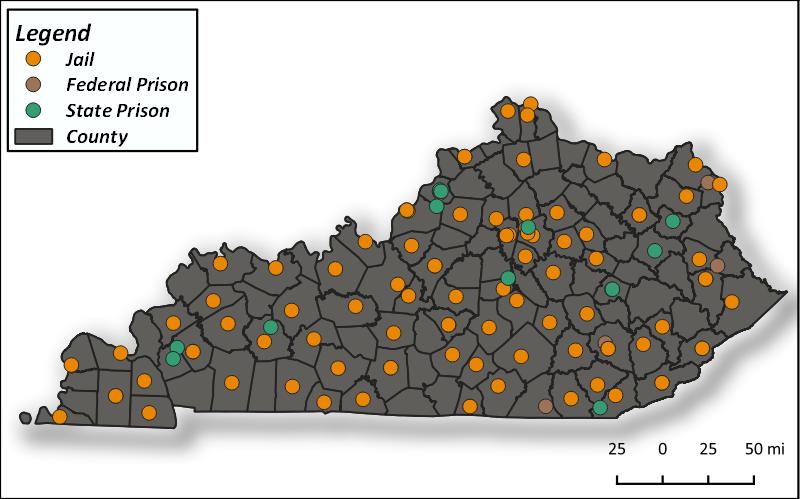
 Jails/Prisons Locations in KY Point
Map
Jails/Prisons Locations in KY Point
Map
 Percent of KY County Populations Incarcerated
Map
Percent of KY County Populations Incarcerated
Map